Dr. Nathan Garrett Publishes in Journal of Emerging Technology in Accounting
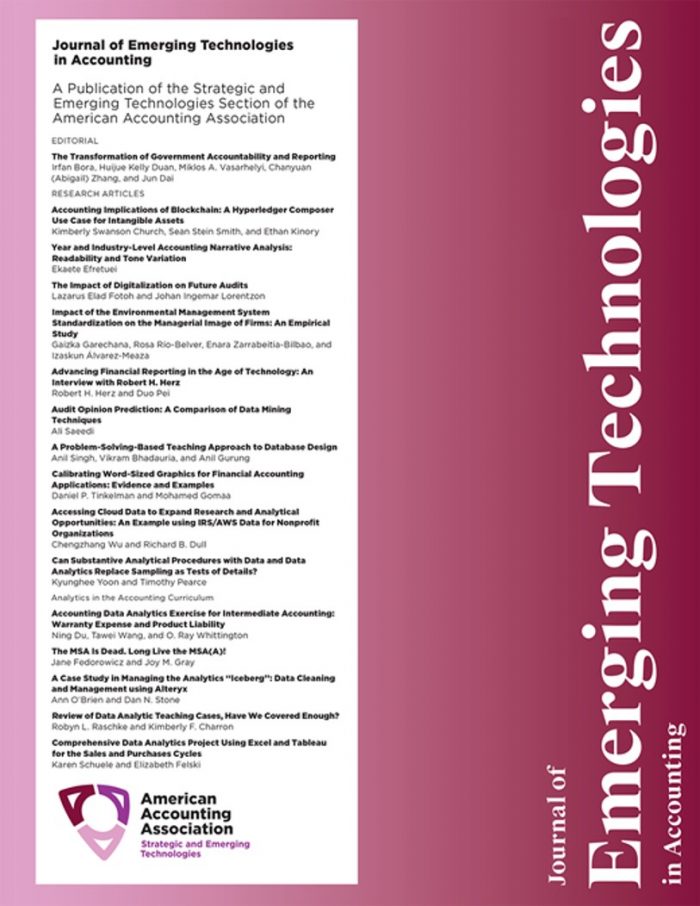
 In February 2022, Dr. Nathan Garrett, Professor of IT and Accounting/Finance, published a peer-reviewed research article titled, “An Evaluation of SEC 10-K Charts” in the Journal of Emerging Technology in Accounting (JETA), the academic journal of the Strategic and Emerging Technologies Section of the American Accounting Association.
Dr. Garrett’s project measured the effectiveness of charts in SEC 10-K filings. Amazon Mechanical Turk and business students participated in the online experiment. The first half of the study asked participants to interpret five charts rarely found in 10-K filings, including combo charts, scatterplots, stacked bars, relative waterfall charts, and absolute waterfall charts.
While participants were successful with combo charts, stacked bars, and absolute waterfalls, half were unable to interpret a scatterplot, and only a handful understood relative waterfalls. The second half of the experiment tested the effects of the three most common design flaws found in 10-K charts. Users were influenced by each of the three flaws: line charts using a non-zero vertical axis, bar charts using an unlabeled non-zero vertical axis, and pie charts using a 3-D perspective. Accounting students should be better trained in deceptive chart designs, and companies should improve their 10-K charts.
Last Updated on March 11, 2022.